| Learning Aims: |
|
| Materials: |
|
| Suggestions for use: |
|
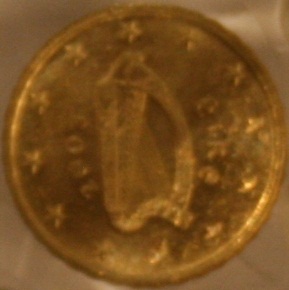
The students should drop the thin slice of cork into the graduated cylinder. Placing their mobile phone on the top of the cylinder, they take a photograph of the cork. It is important that the same optical/digital zoom settings are used throughout the experiment. They then add some water and measure its height inside the cylinder before photographing the now-floating piece of cork. The students should repeat the process at least six times for different water levels and finally should measure the height of the cylinder itself. The purpose of this exercise is to allow the creation of a ‘calibration graph’ that relates the diameter of the cork circle in image pixels to its distance from the camera (obtained by subtracting the height of the water in the cylinder from the height of the cylinder). The students then empty the cylinder and drop a coin to its base. They photograph the coin in the absence of water, then completely fill the cylinder and photograph the coin through the water. By comparing the diameter of the coin (in pixels) when imaged through the water to their calibration graph, they can determine the apparent depth of the coin. This analysis can be performed by the students at home. Since each student will have used different levels of water, a graph of real depth versus apparent depth can be created in Excel that includes data from each of the students. The slope of this graph then gives the refractive index of water. One simple method of analysing the images is to load them into software such as Microsoft Picture Manager (found in Office tools) and crop the photo so that only the coin remains. Since the coin is circular, the image dimensions then give the diameter in pixels. The experiment provides a good introduction to a number of topics. Firstly, the calibration graph will not be linear and so students must draw ‘best fit curves’. Secondly, it provides a good example of experimental errors – cameras with a higher megapixel count will be more accurate than those with lower counts, and the apparent diameter of the coin is related to both the height of the cylinder (ie the distance of the camera from the base of the cylinder) and the height of water added.
|
| Possible questions: |
|